Energy analytics is simply keeping track of how much electricity your machines use and turning that into useful insights. It answers questions like which machine uses the most power, and which shift consumes the most energy.
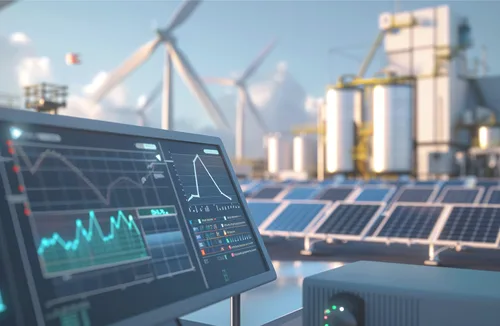
In Energy Analytics we have 7 Modules: Dashboard, Real Time Monitoring, Energy Analysis, Data Management, Reports, Master Data, and Administration. Together, these turn live machine data into a real-time dashboard, downtime and material-to-machine analysis, and exportable reports broken down by shift, customer, product, and mill. Master Data and Administration sit underneath, linking every reading to the correct machine or order and controlling who can access the system.
Gives a real-time overview of total energy consumption across all machines in a single view.
Displays day-wise bar charts and machine or customer-wise breakdowns for quick decision making.
Displays live metrics for each machine (M1 to M6) including mill load, energy consumption, number of workers, and capacity utilisation, all updating in real time from the PLC.
The timeline bar at the bottom of each machine card shows running vs. stopped status throughout the shift, where green indicates the machine was active and red indicates downtime, making it instantly visible which machines are idle or stopped.
Energy Analysis has two modules: Downtime Analysis and Material to Machine (Mat2Mac) Analysis.
Downtime Analysis: Tracks periods when machines were inactive or not consuming energy during working hours. Helps management understand energy wasted during unplanned stoppages or idle running.
Material to Machine Analysis (Mat2Mac): Maps which materials were processed on which machines and how much energy was consumed for each. Helps calculate the exact energy cost per material type, enabling better production planning and cost allocation.
Handles the storage and organisation of energy data collected from the SCADA and MySQL database.
Allows users to manage, correct, or review raw data records before they appear in reports.
Contains five dedicated report types: Alert Report, Production Shift Report, Customer Wise Report, Product Wise Report, and Mill Wise Report, covering every key dimension of plant operations. Each report can be exported and used for performance reviews, customer billing, energy audits, and shift-wise production analysis.
Stores reference information like machine names, customer details, materials, and shift timings.
Acts as the foundation that links energy readings to the correct machine or production order.
Manages user accounts, roles, and access permissions for the platform.
Handles system settings and configurations for the plant and connected devices.
MPM Product Brochure
Information - English - 07-07-2026 - 52.72 MB
Gain full visibility into machine performance, cut downtime costs, and calculate exact energy expenses per order.