FISHBONE DIAGRAMS
Fishbone diagrams are a simple cause-and-effect graphic method of clarifying, analysing, and resolving problems.
Ishikawa diagrams were popularized in the 1960s by Kaoru Ishikawa, who pioneered quality management processes in Japan which then spread throughout quality circles globally.
Fishbone Diagrams are very useful when all variables are known. By continuous use of this method, process variables are updated and the accuracy and speed of achieving focused outcomes is vastly improved.
What do foundrymen have to do with fishbone diagrams? Plenty!
It's a way of life for foundrymen in QC and rejection meetings!
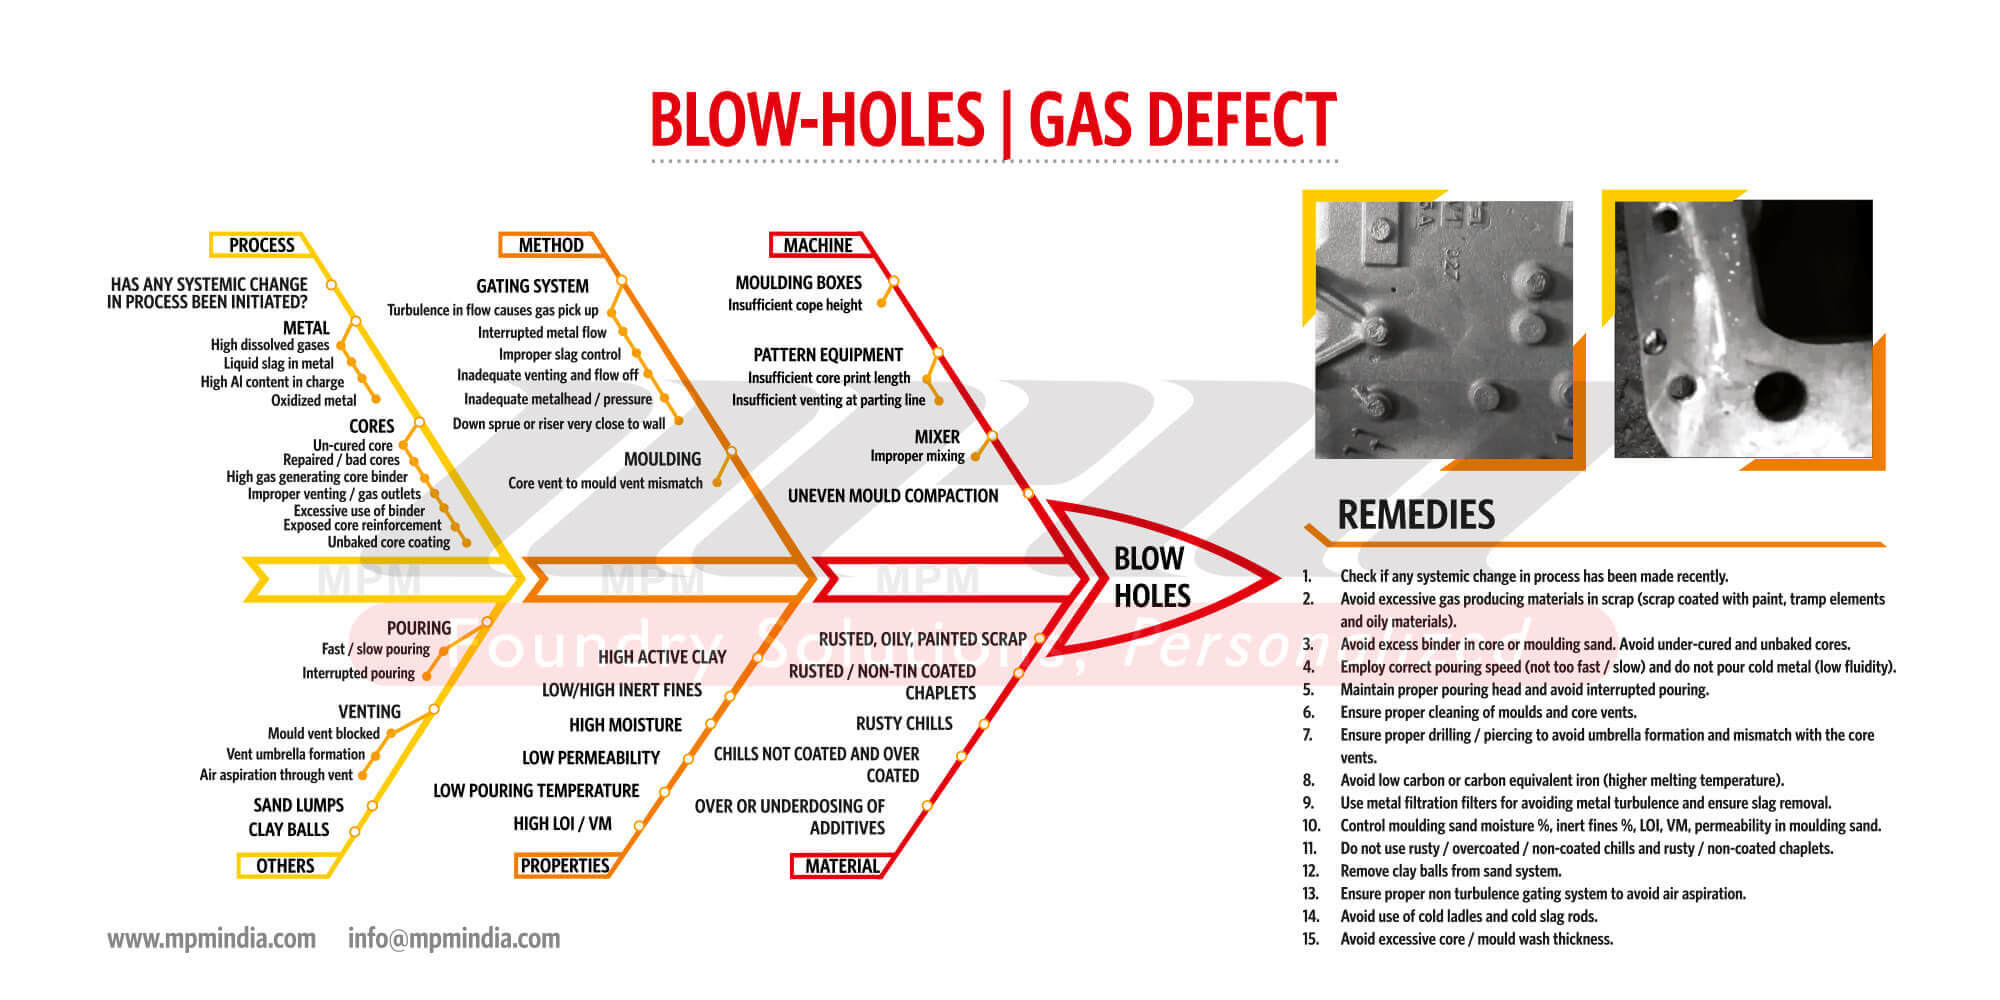
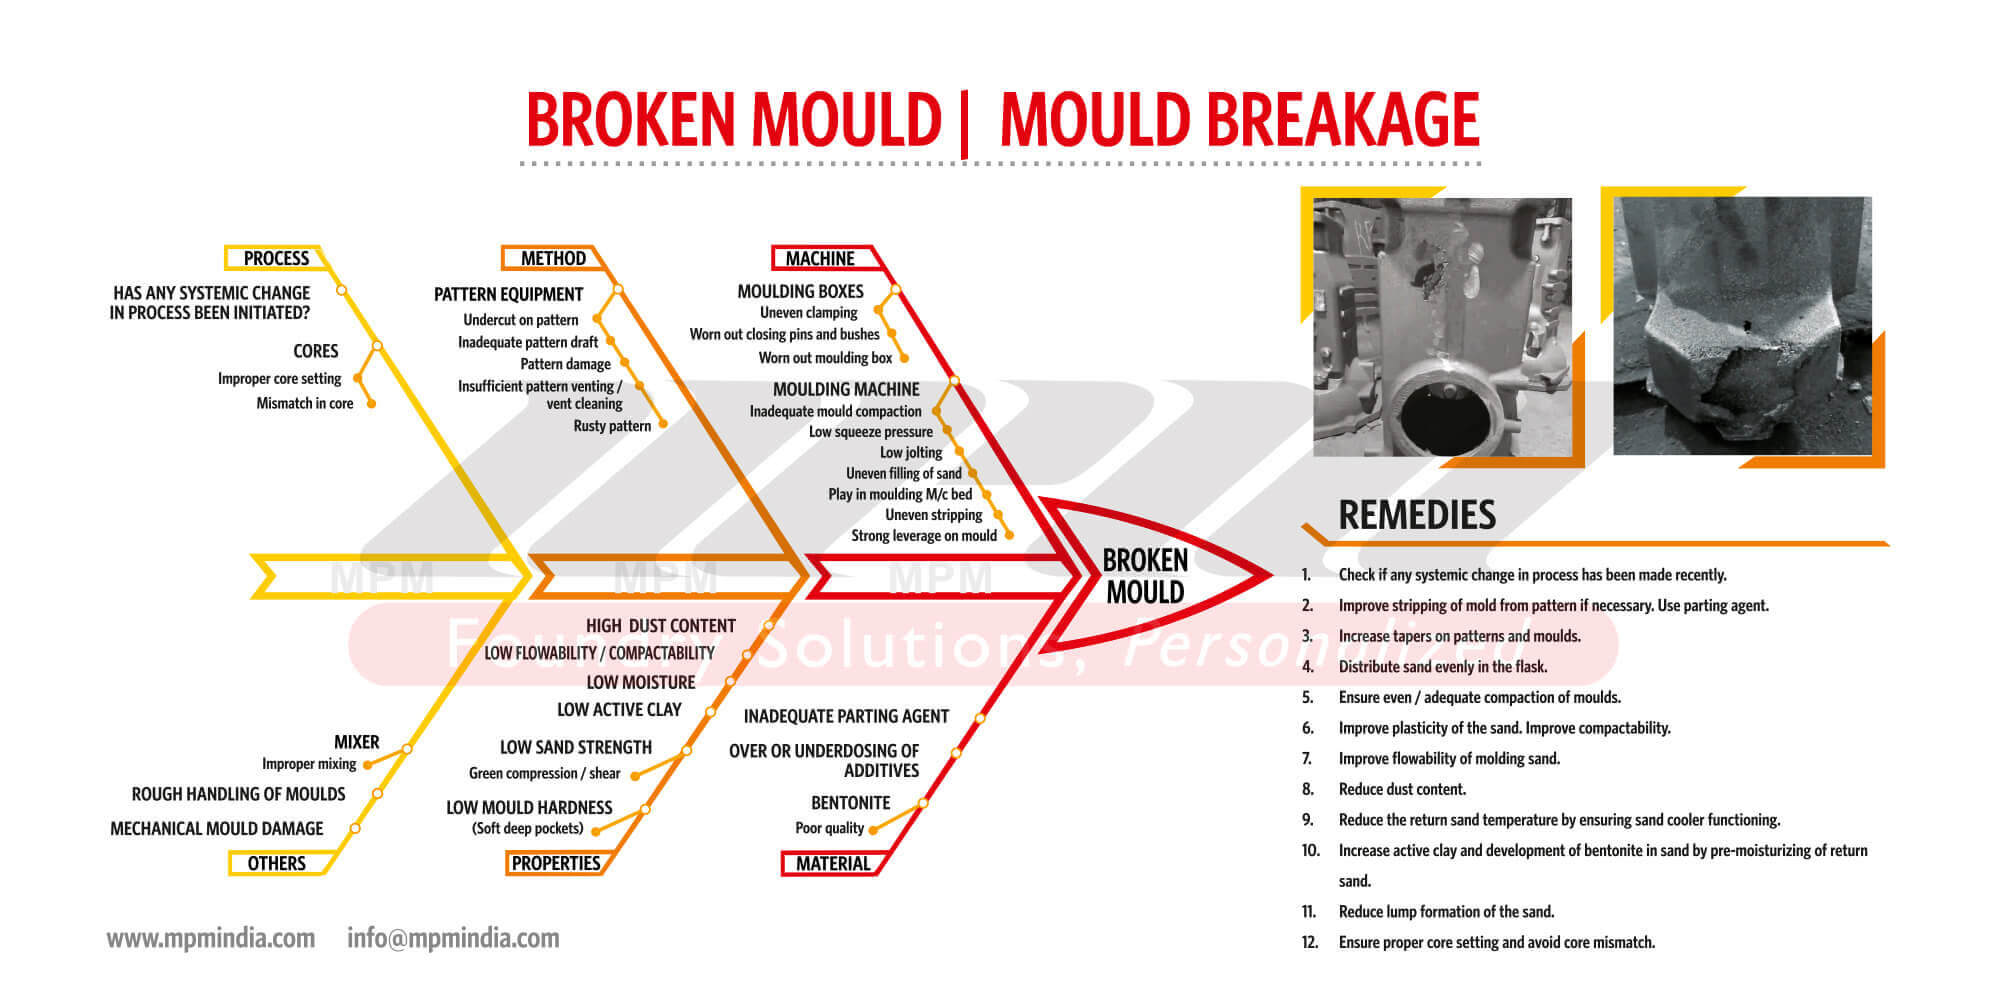
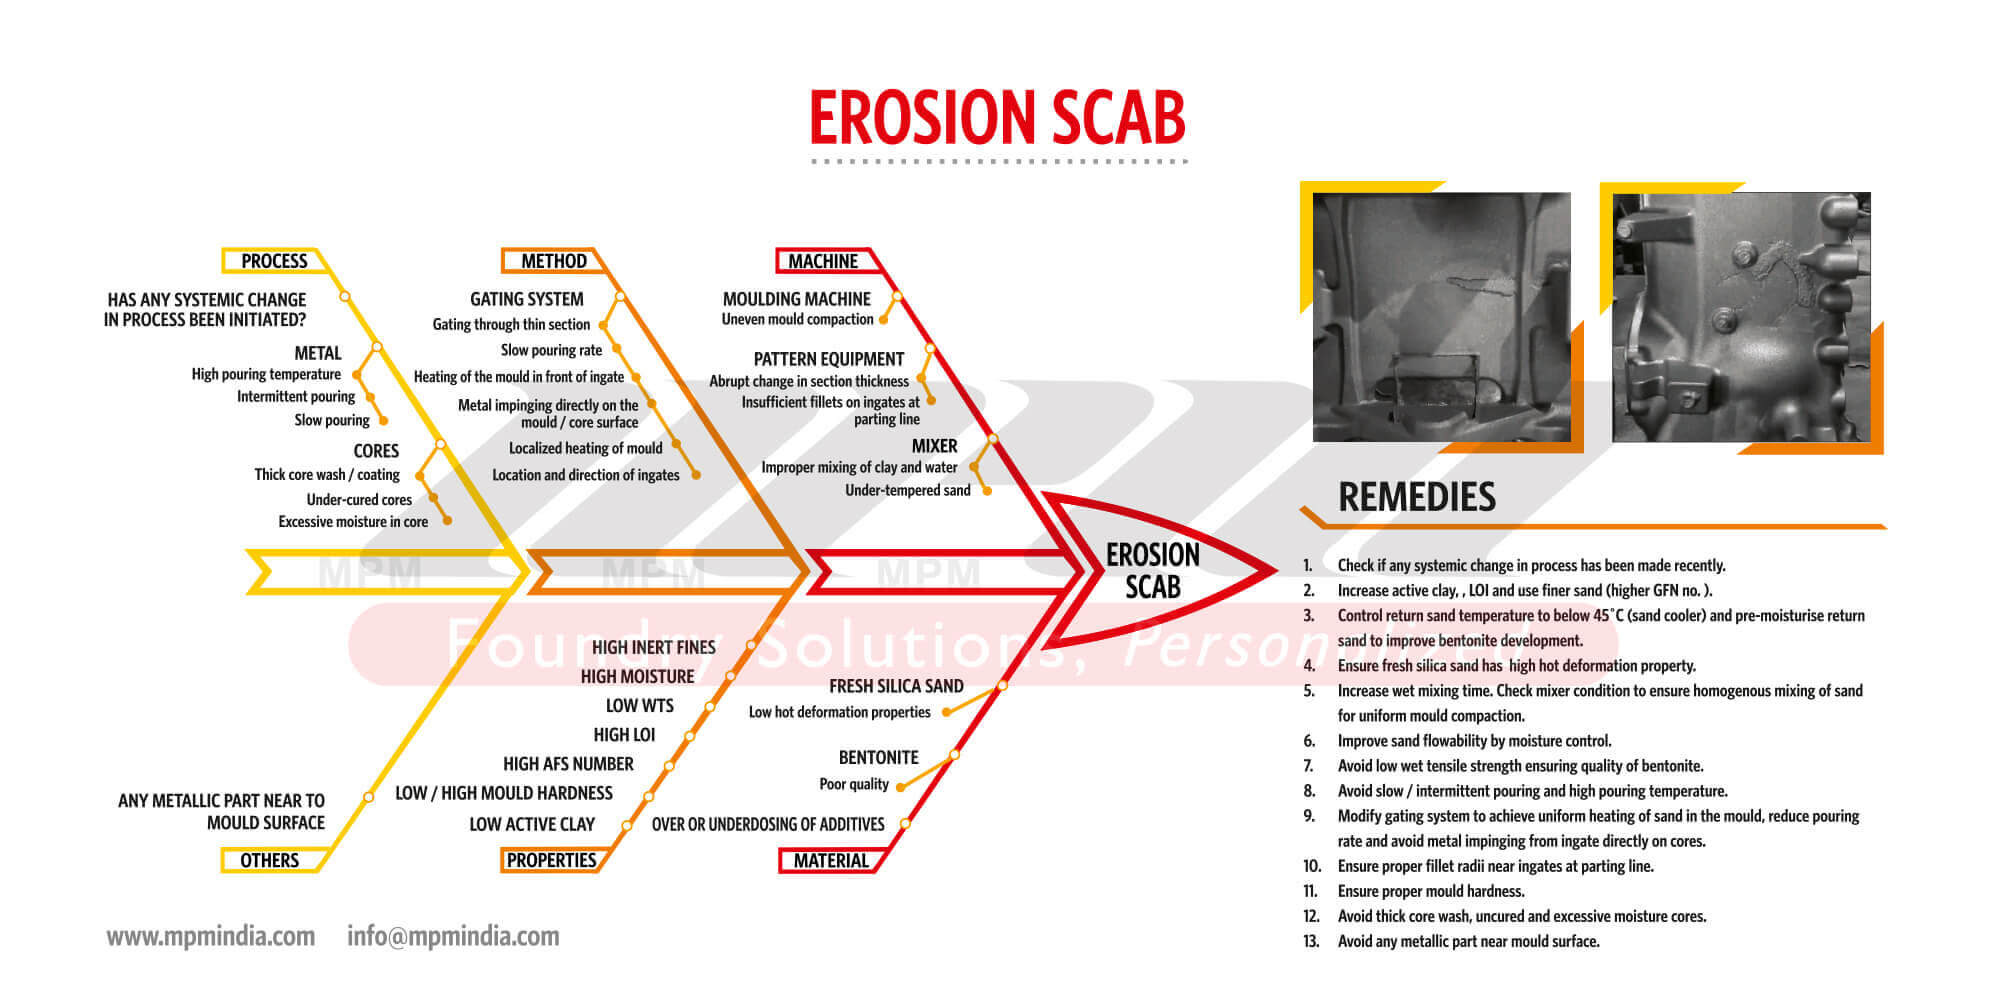
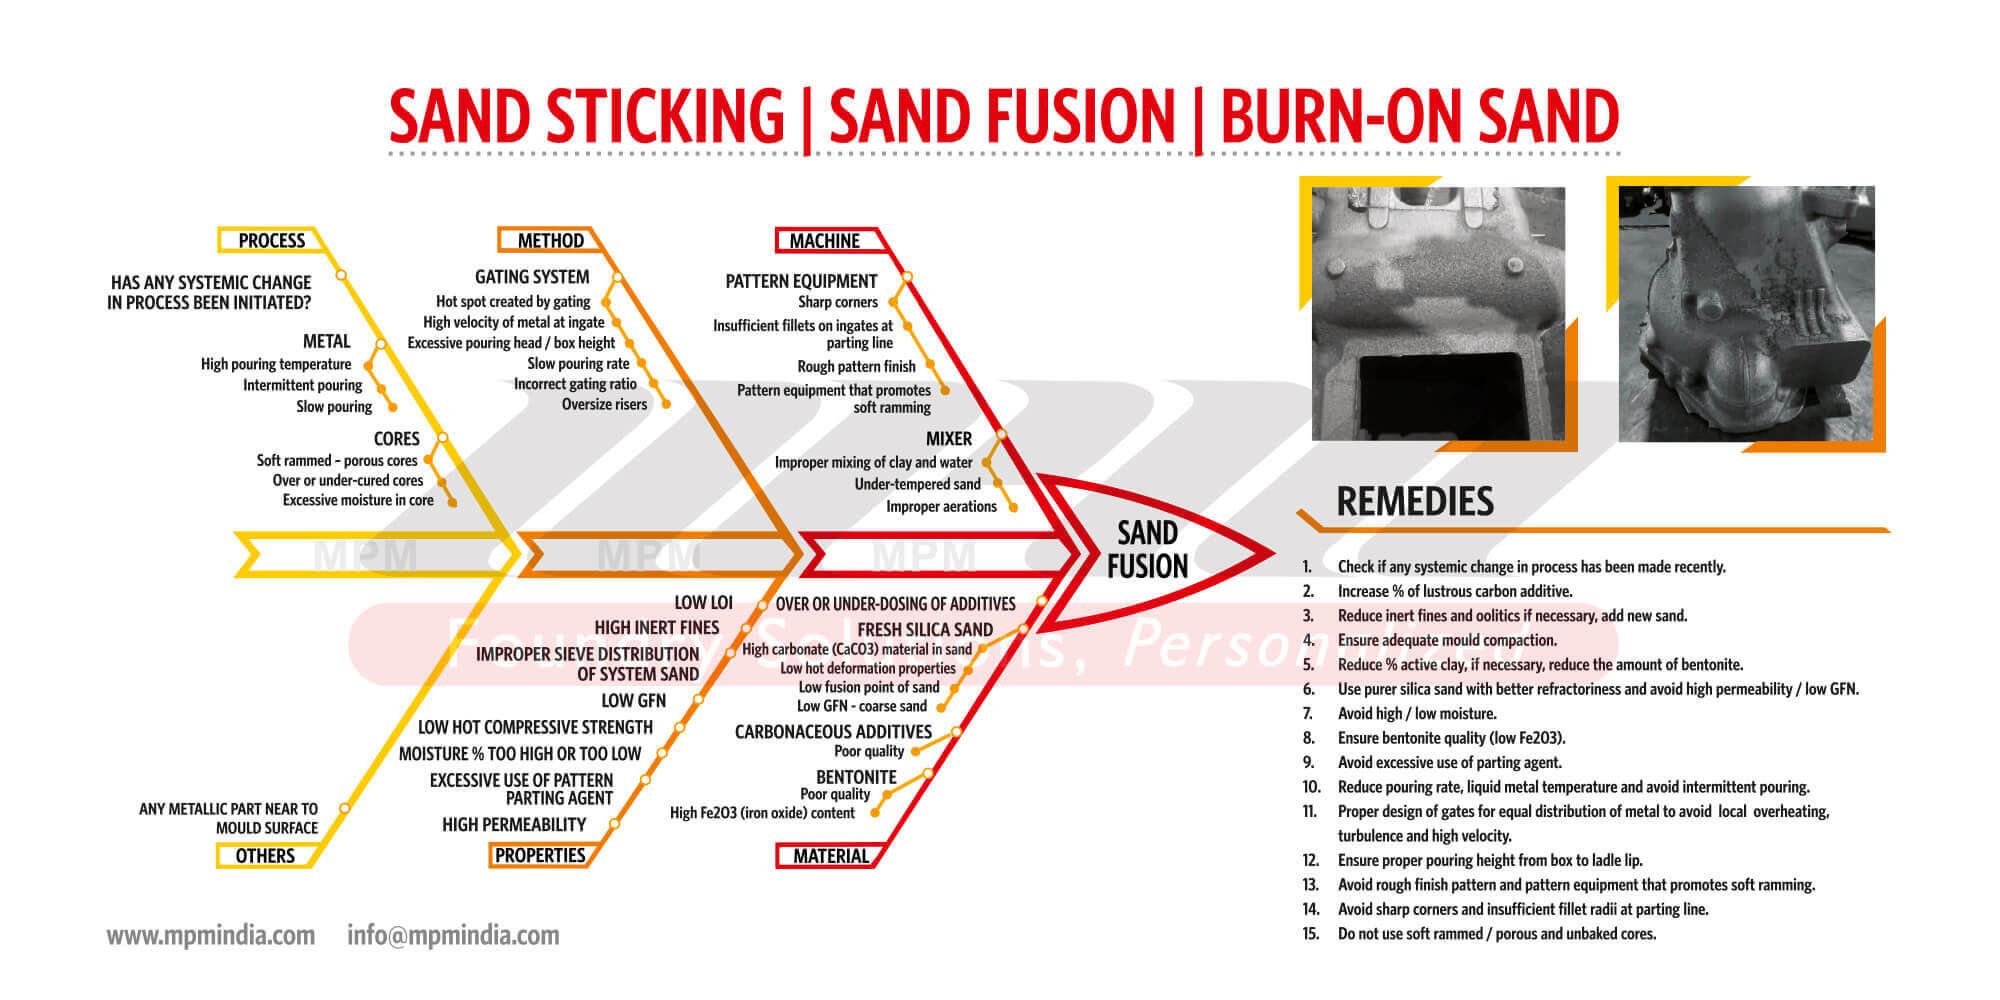
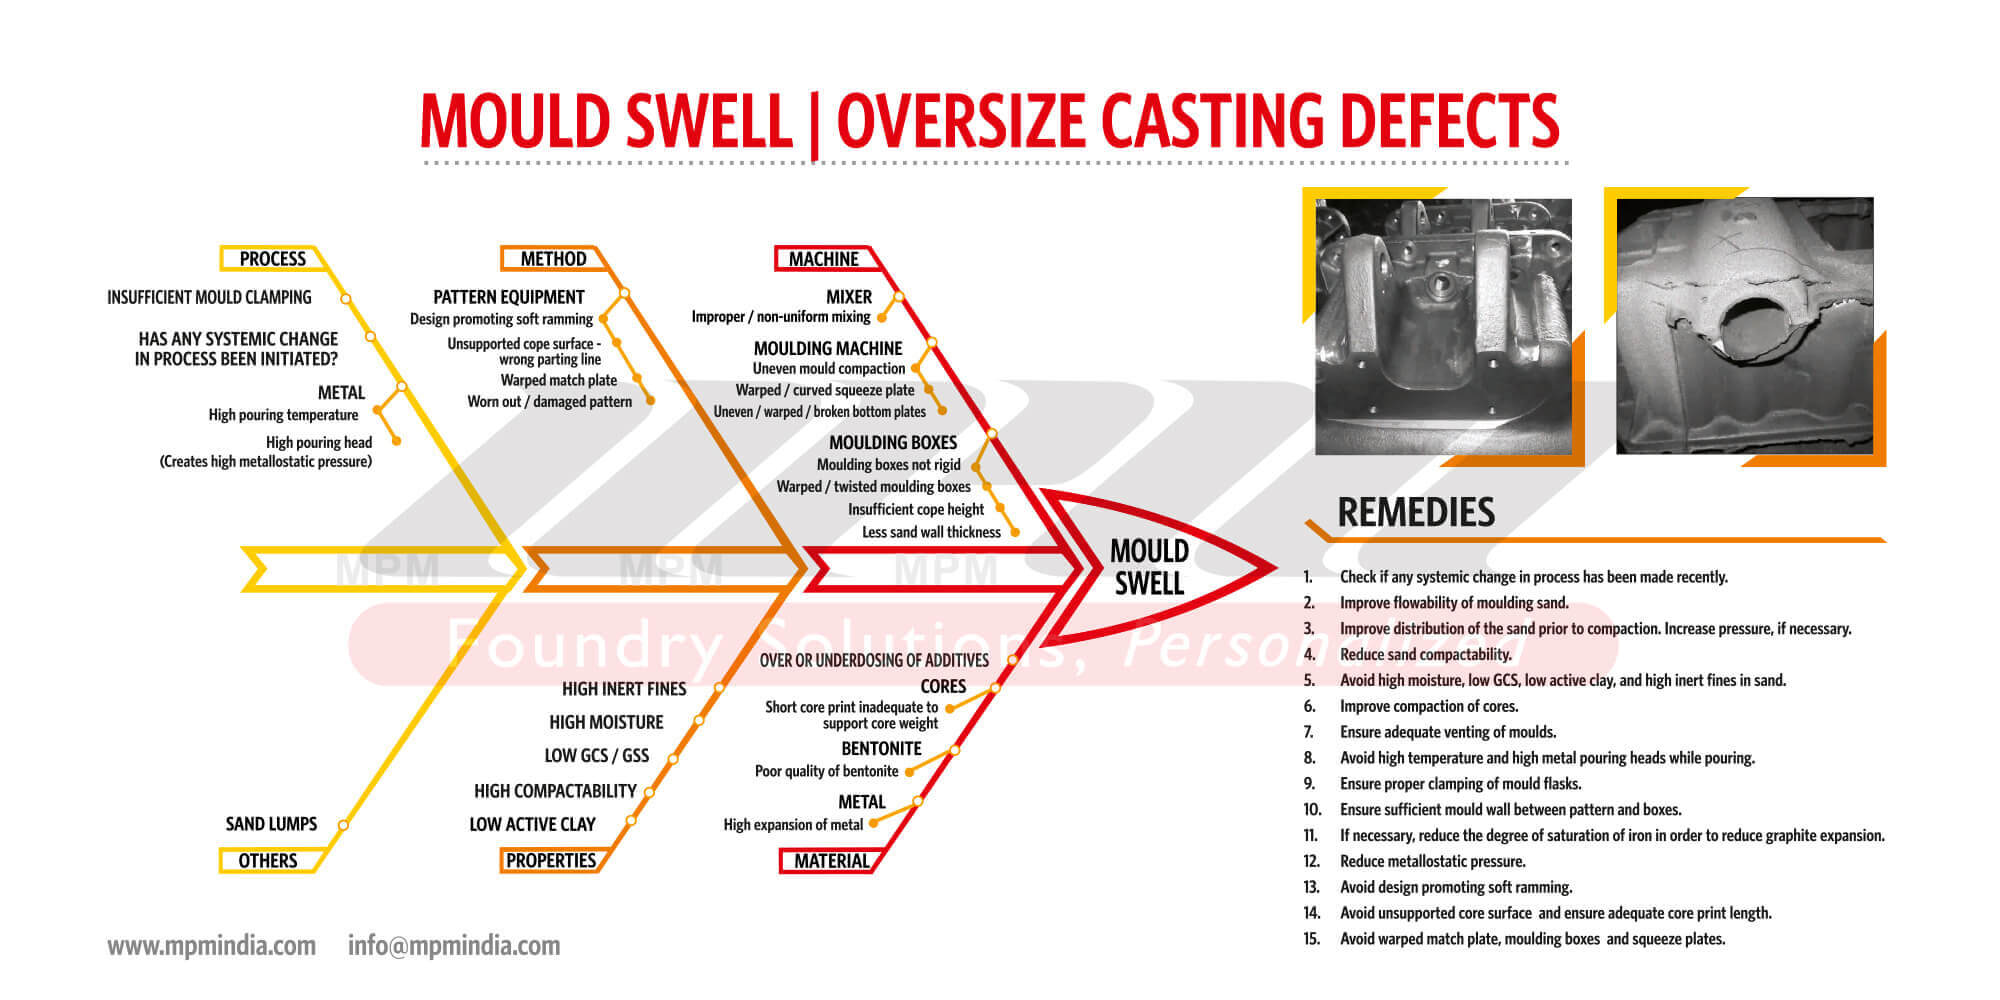
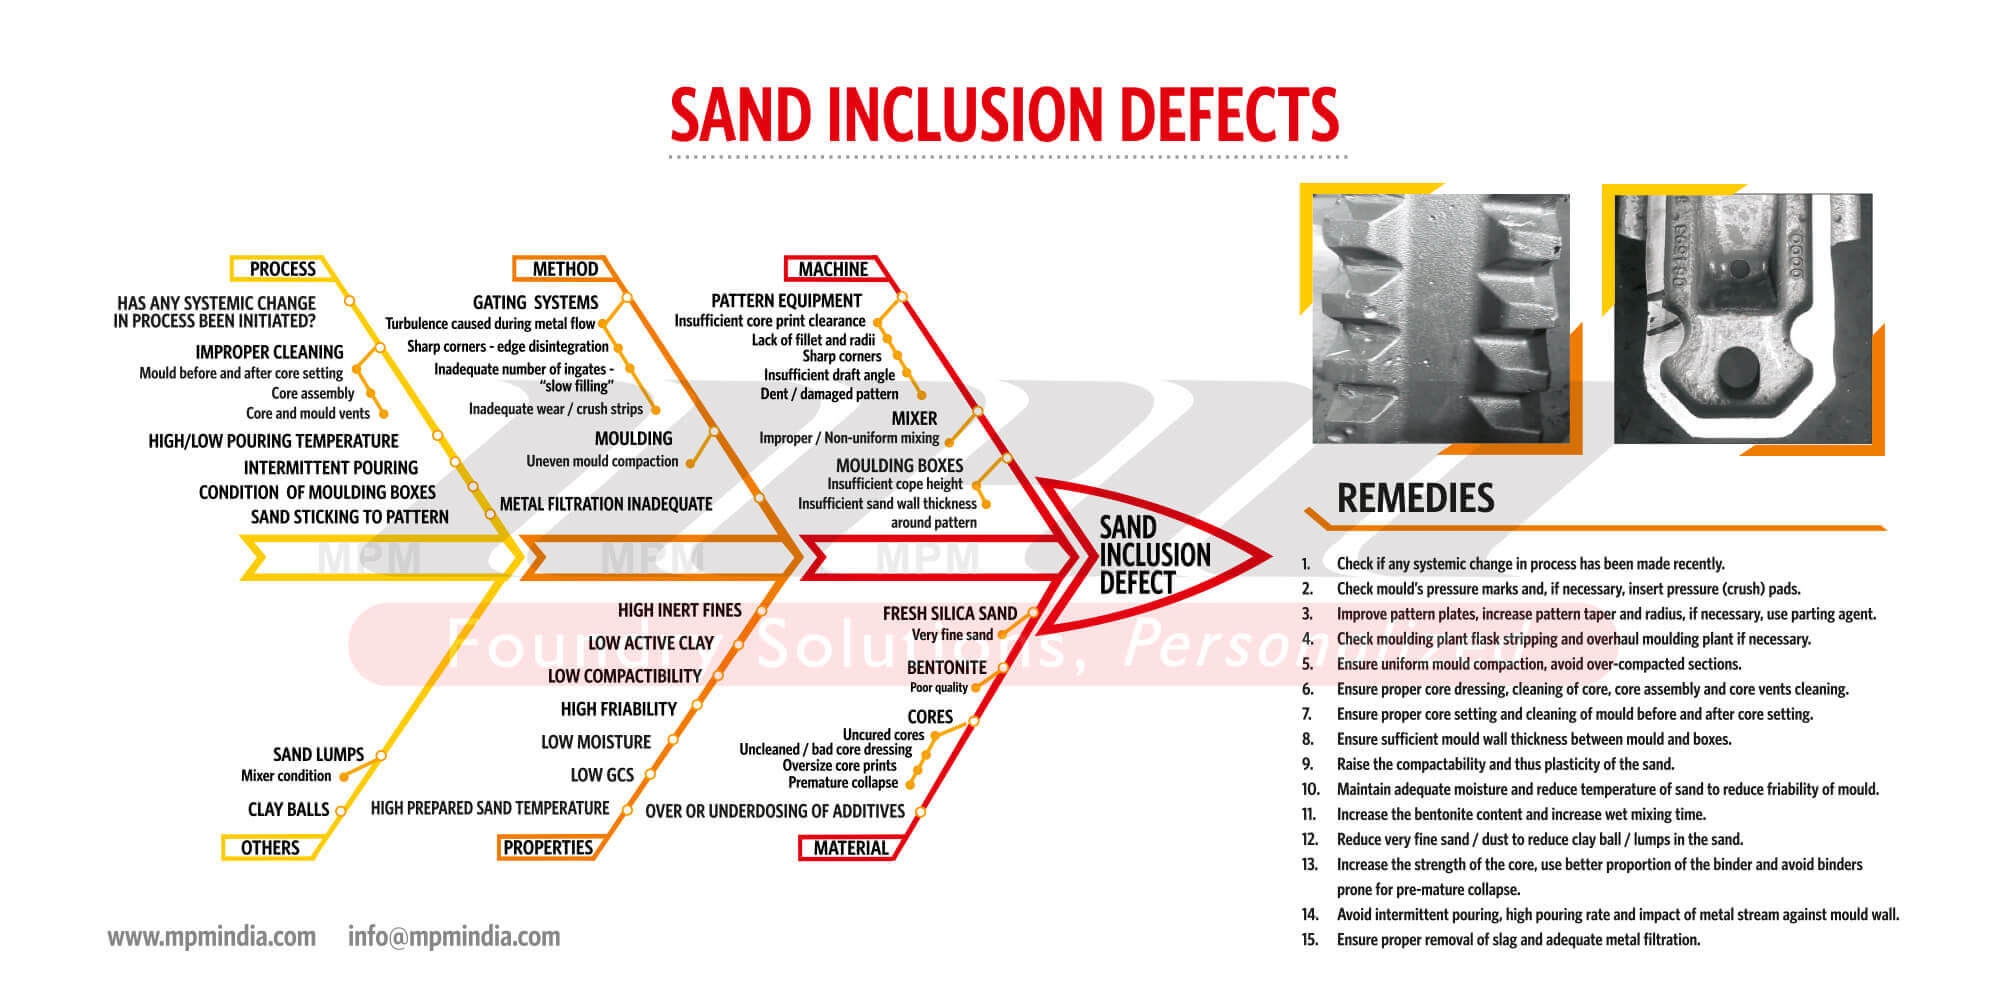
In pursuit of MPM’s spirit of sharing our decades of know-how in green sand management and control, our team of experts have created readymade FISHBONE Diagrams for problem solving and quality control in foundries.
These ‘cause-and-effect’ analysis charts, limited to 6 major casting issues, account for almost 90% of casting problems related to green sand moulding.
We hope these charts will facilitate brainstorming by foundry teams as they explore the reasons for a specific defect, by process of examination and careful elimination of non-applicable variables.
Get this unique and immensely useful tool, in PDF format, for use in your foundry; on your computers or hand held devices; free of cost from our website www.mpmindia.com/fishbone. Today!
Get your Fishbone Diagram Charts
We request your contact details in the form below in order to e-mail you a downloadable PDF.
You can also order High Quality Large-Format Prints for a nominal amount by clicking below.